Test solutions
Scaling Solutions & Techniques
The Amazon EC2 Auto Scaling service provides different scaling solutions depending on the needs and usage patterns of your workload. To implement the most effective scaling strategy, you’ll need to analyze, estimate, observe, and plan the use of each scaling type or combine multiple approaches to increase the flexibility of your system.
In this section, we’ll explore each solution in detail, but first, let’s review the available scaling approaches.
Manual Scaling
Manual scaling involves adjusting the desired capacity parameter in your Amazon EC2 Auto Scaling group to scale instances up or down in your target group. This approach is useful for quick, one-off situations where you need to temporarily add or remove capacity.
Scheduled Scaling
When you have predictable workload patterns or know when your application will experience high traffic (such as daily, weekly, or annual events), you can configure Amazon EC2 Auto Scaling to automatically adjust capacity according to a defined schedule.
Dynamic Scaling
For workloads with unpredictable traffic patterns that are difficult to forecast, you can leverage automatic scaling with Amazon EC2 Auto Scaling. Dynamic scaling policies respond to real-time metrics (such as CPU utilization or request count) to scale your application resources appropriately.
Predictive Scaling
Amazon EC2 Auto Scaling can also analyze historical workload patterns to predict capacity needs for the next 48-72 hours. For systems with variable but somewhat cyclical demands, you can combine predictive scaling with dynamic scaling to optimize resource utilization and responsiveness.
Since we need historical data for predictive scaling to work effectively, you must complete the steps in 2.6 - Prepare metrics for predictive scaling before proceeding with this section.
Installing the Load Testing Tool
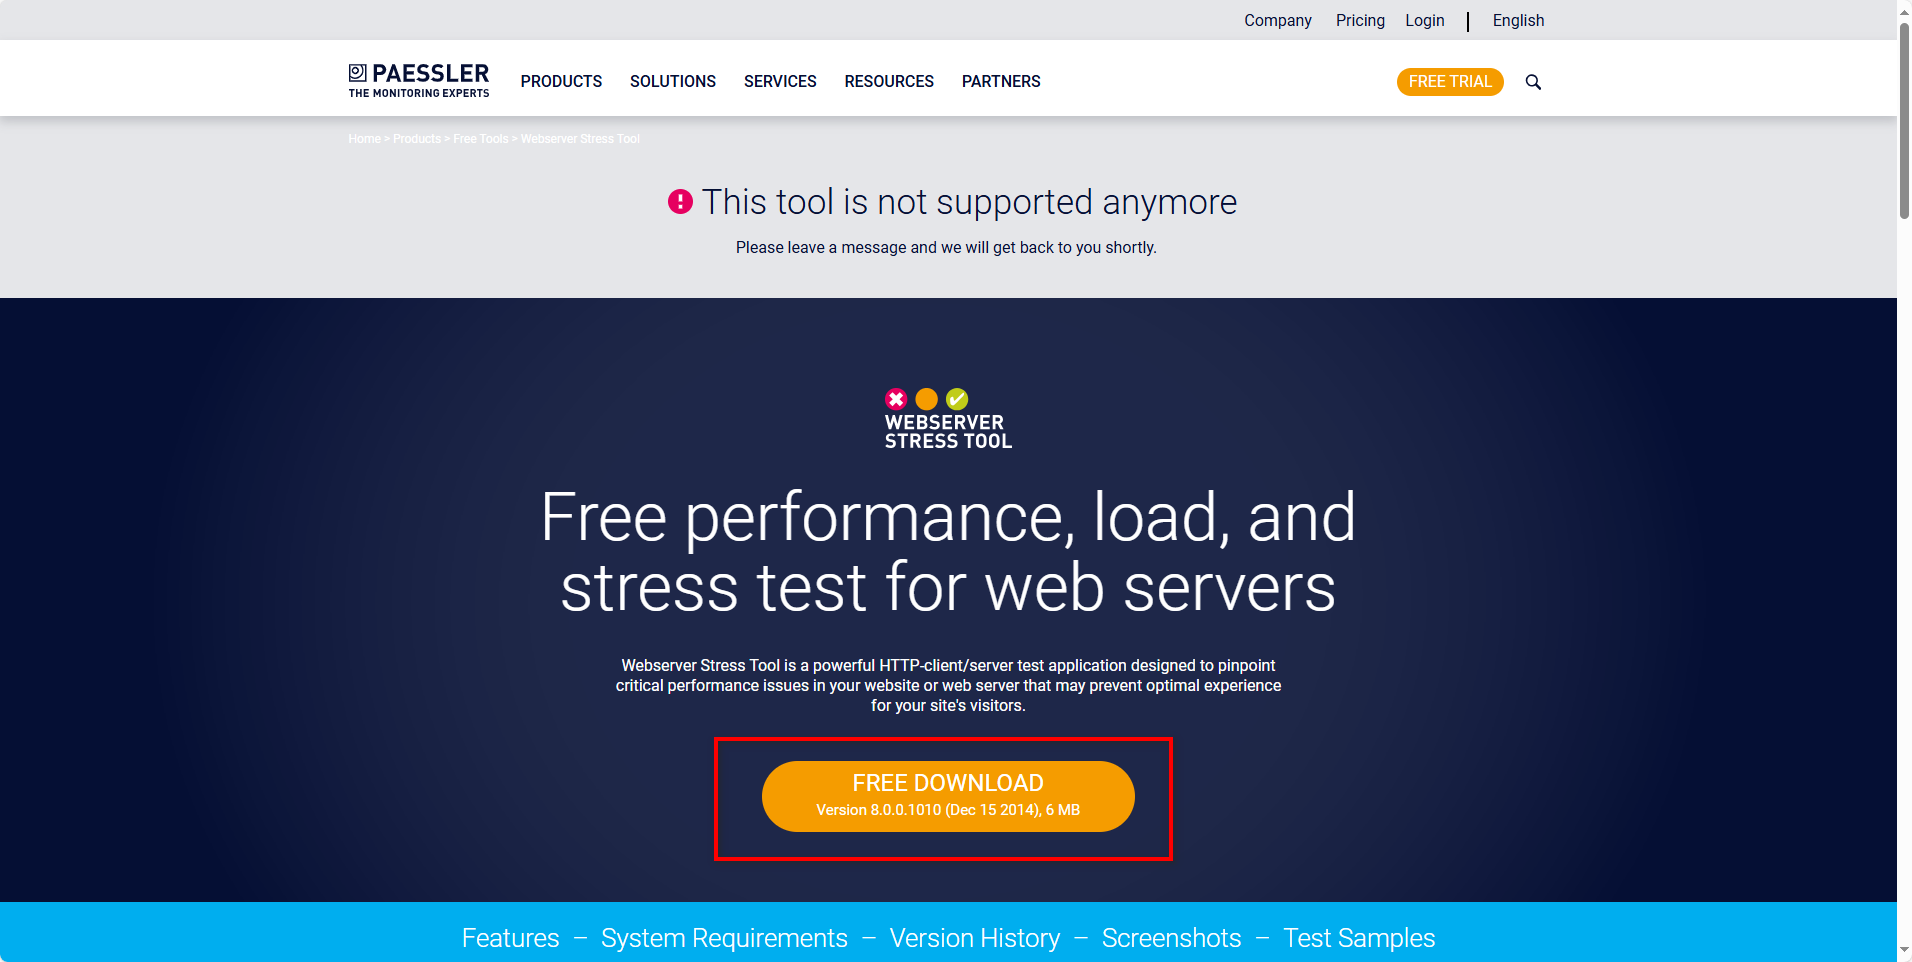
To simulate high traffic conditions for our tests, we’ll use a load testing tool. Download the testing program from: https://www.paessler.com/tools/webstress

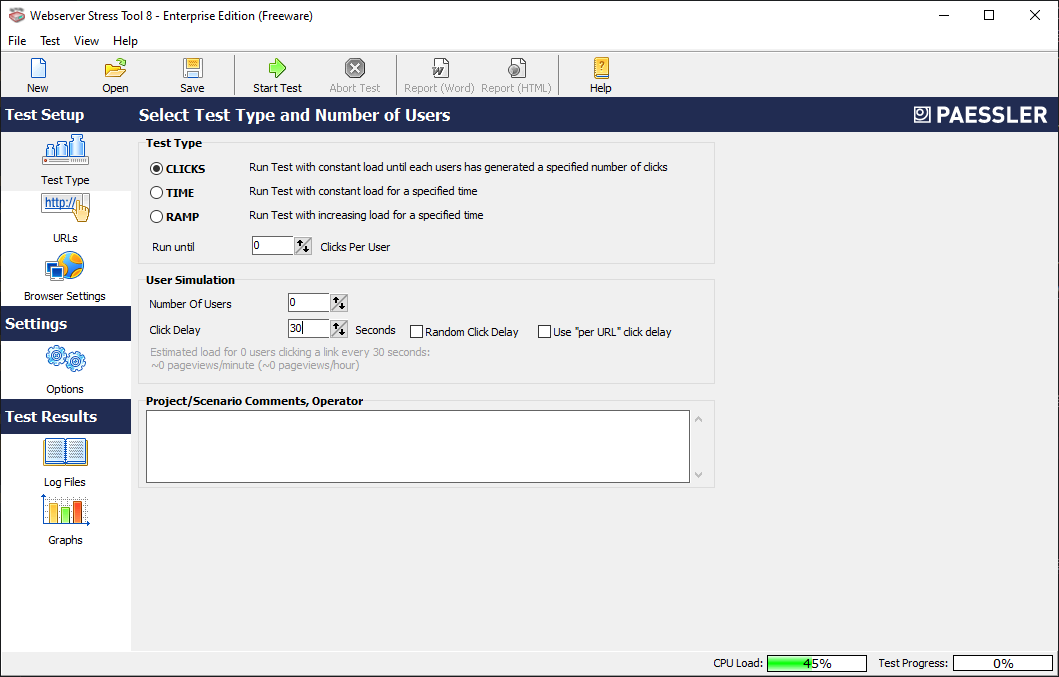
After downloading the RAR file, extract and install the application. Once installed, launch the program to see the interface shown below:

Content
- Test the manual scaling solution
- Test the scheduled scaling solution
- Test the dynamic scaling solution
- Test the predictive scaling solution
This section requires significant time and careful observation. You can analyze results while running the simulations, but be patient and thorough when documenting your findings.