Read metrics of predictive scaling solution
Predictive Scaling
From the traffic and workloads that the system receives and sends each day, ASG can “predict” the future traffic and workloads for the upcoming days. This helps ASG respond better by launching or terminating instances accordingly. Typically, Predictive Scaling is used in combination with other types of scaling.
Configuration
- As in the previous section, I will manually scale in with ASG and wait for ASG to terminate all the instances created by this service.
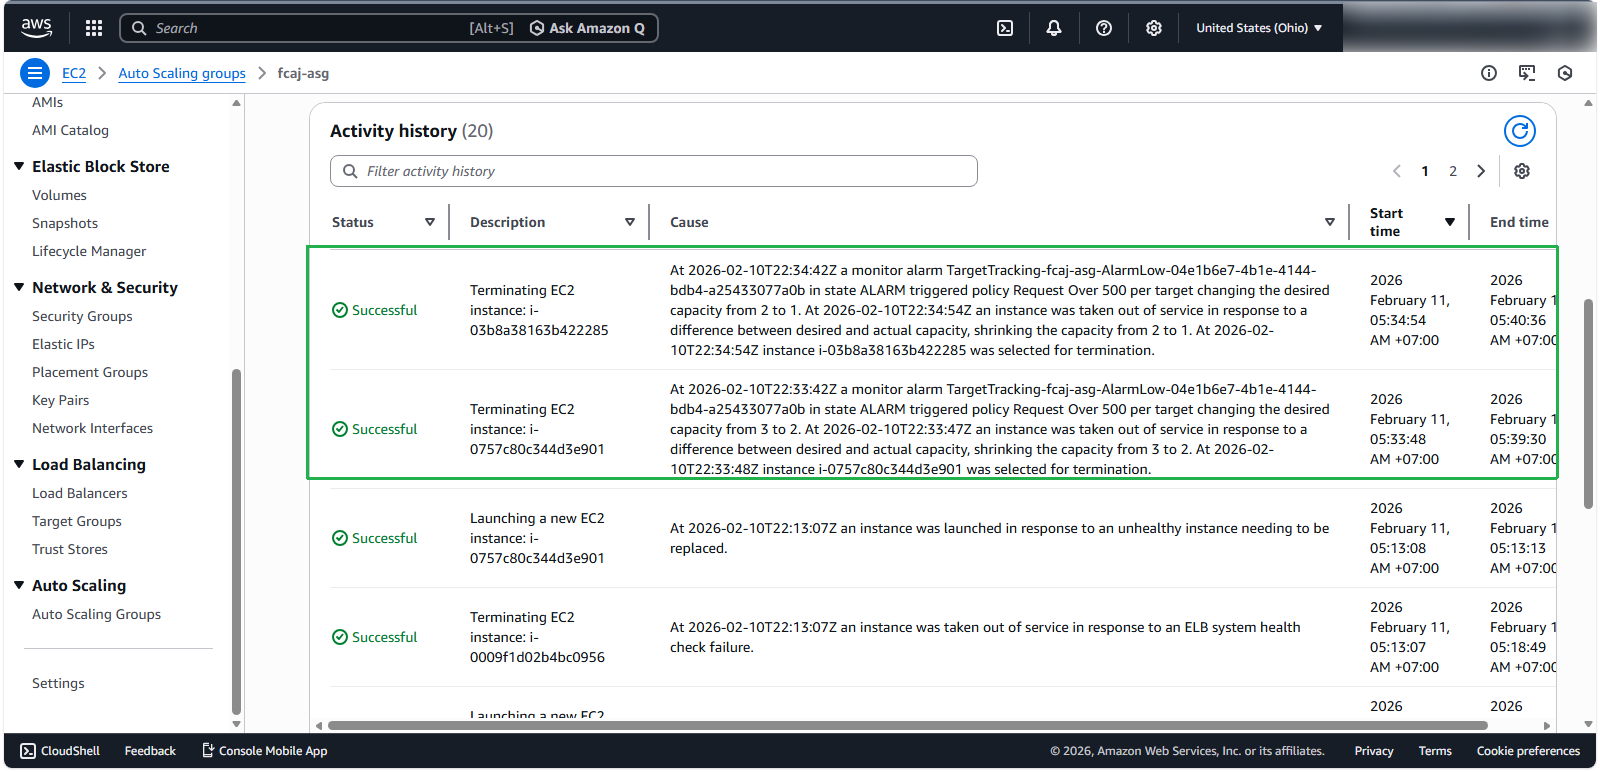
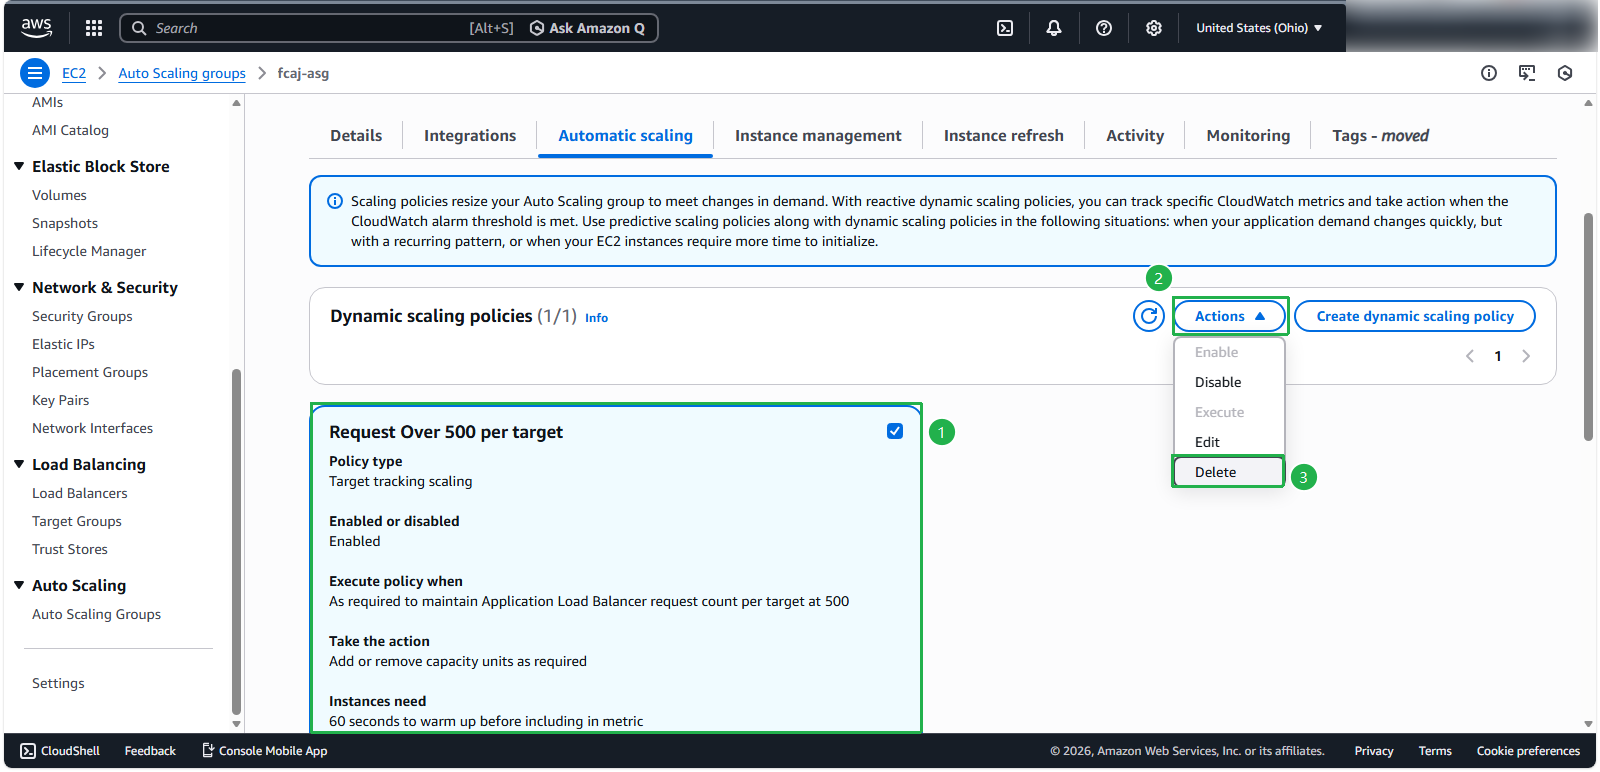
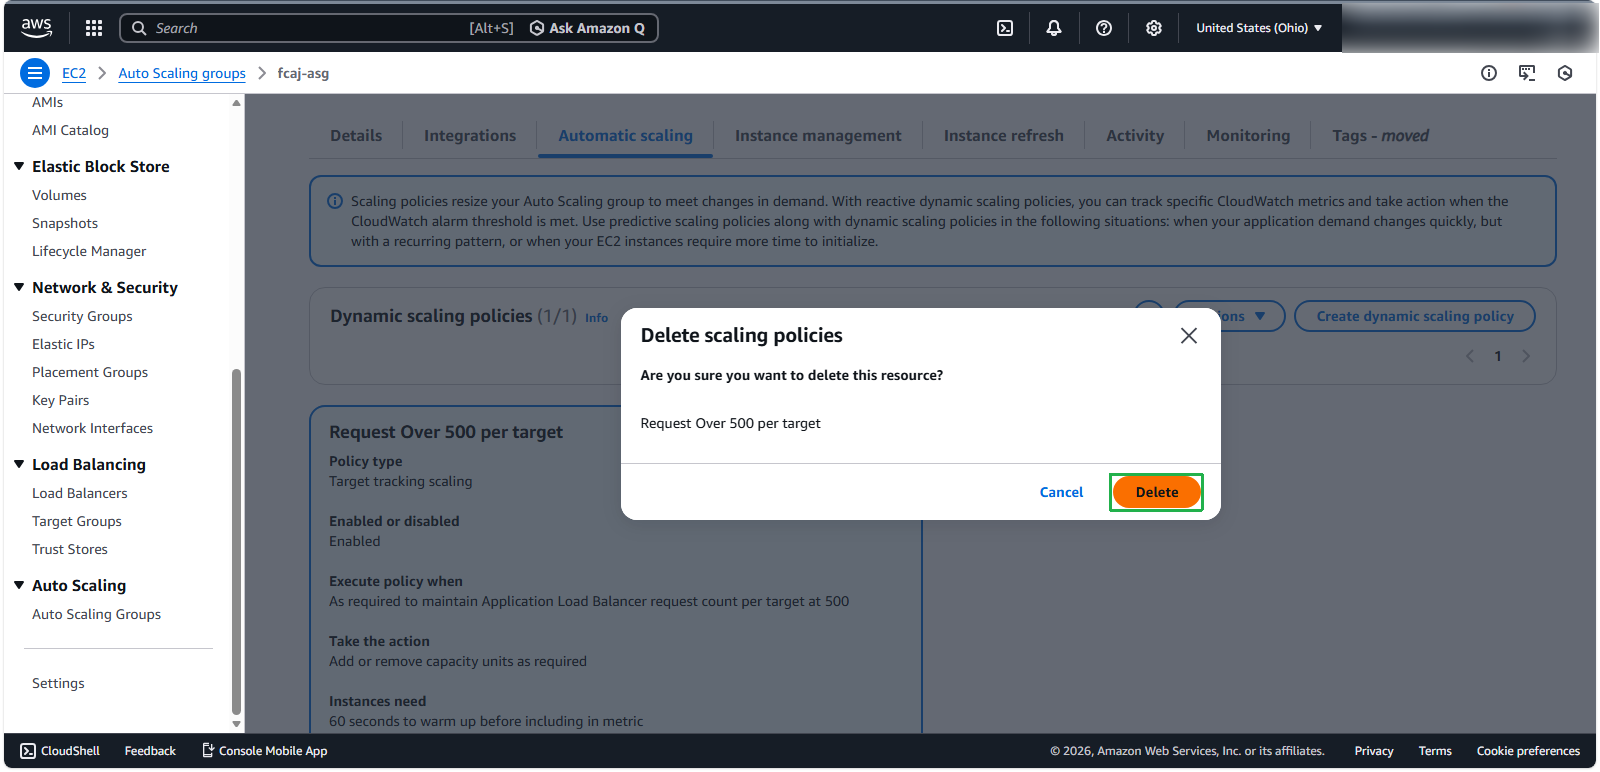
- Next, delete the automatic scaling policy to avoid affecting this test.
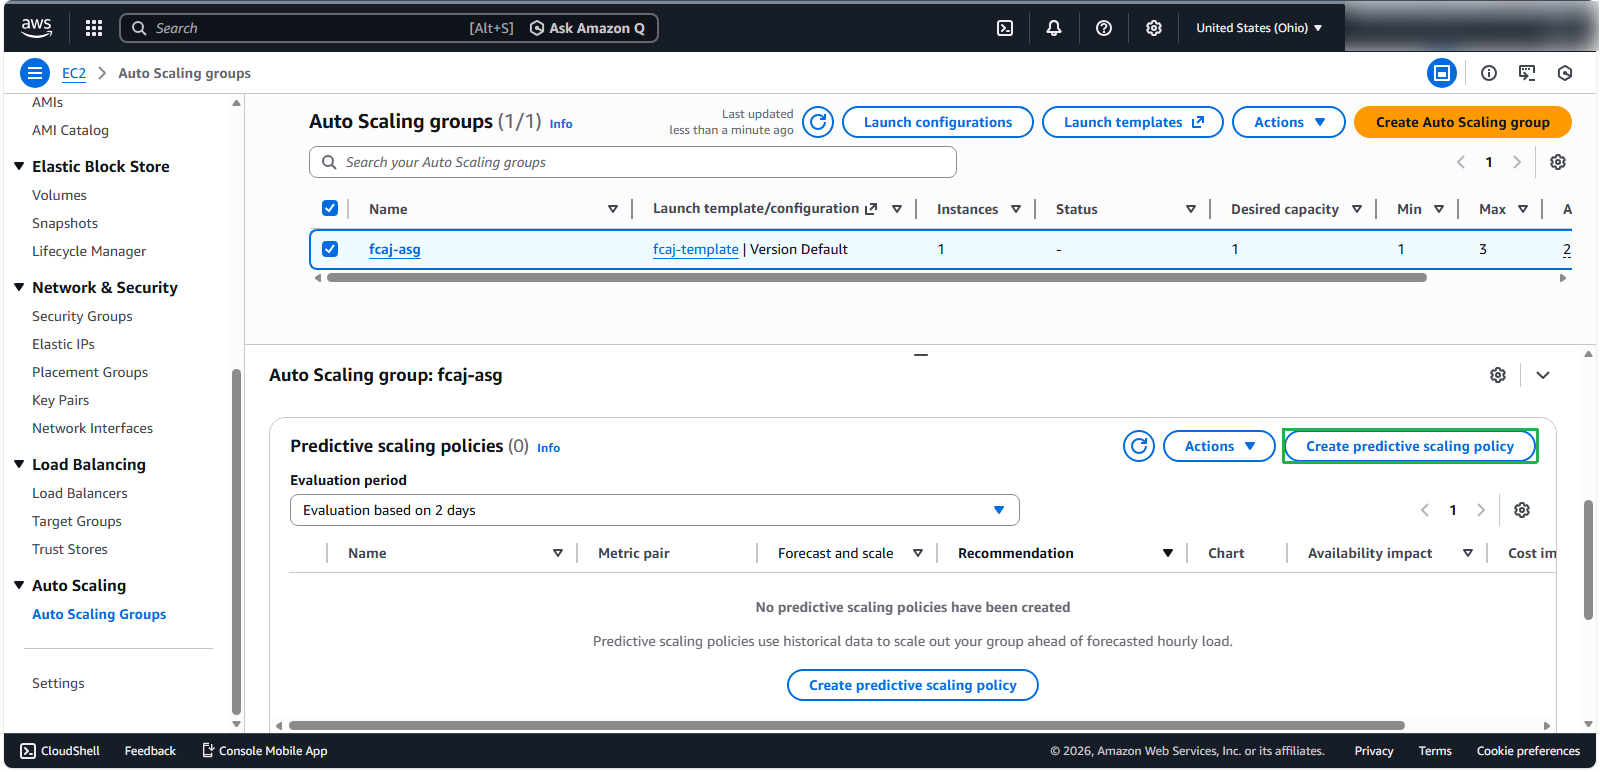
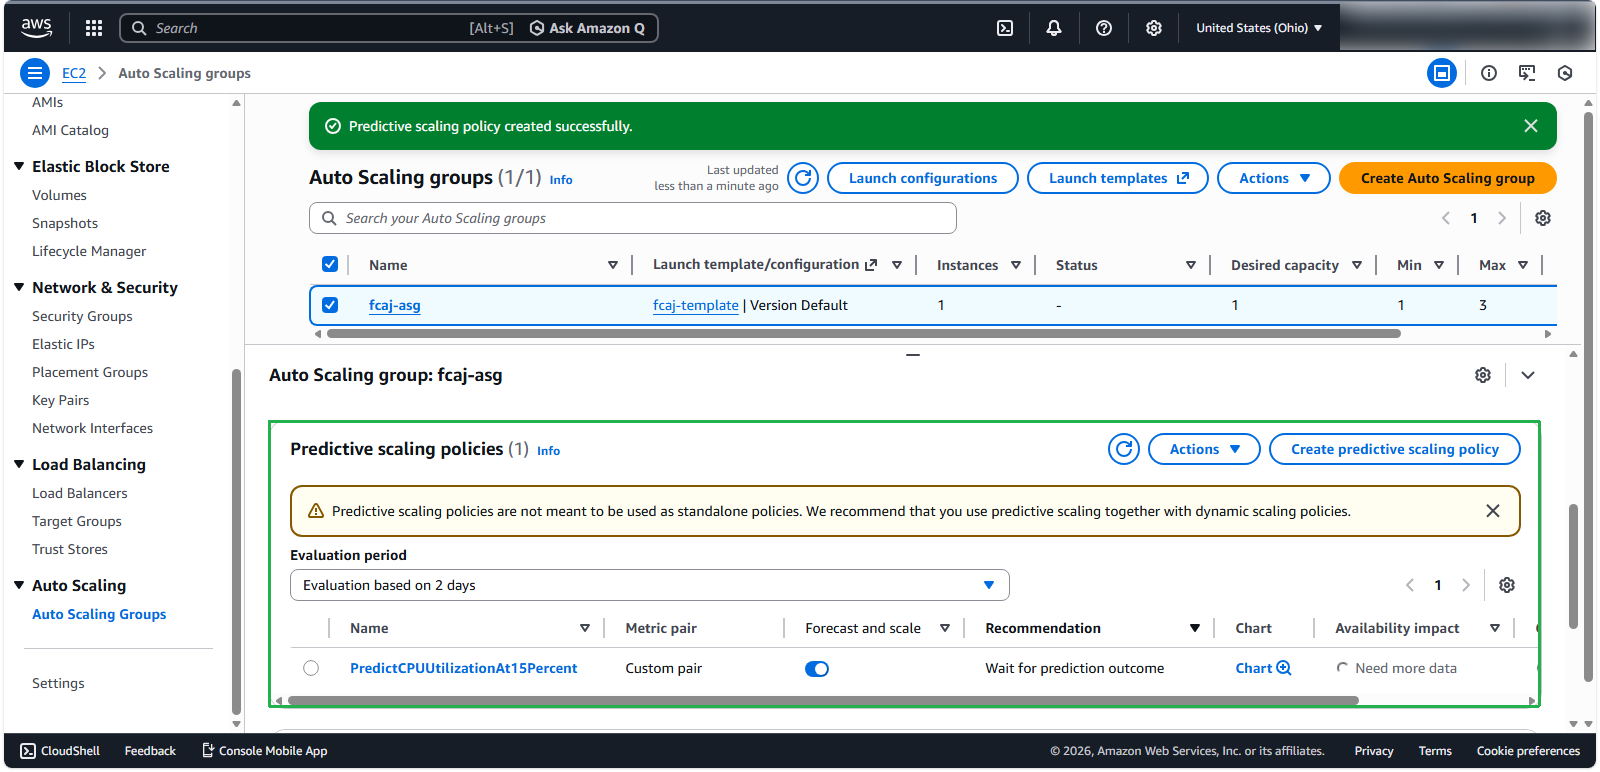
- Then, go to the Automatic Scaling tab, scroll down to Predictive scaling policies, and click Create predictive policy to create a new one.
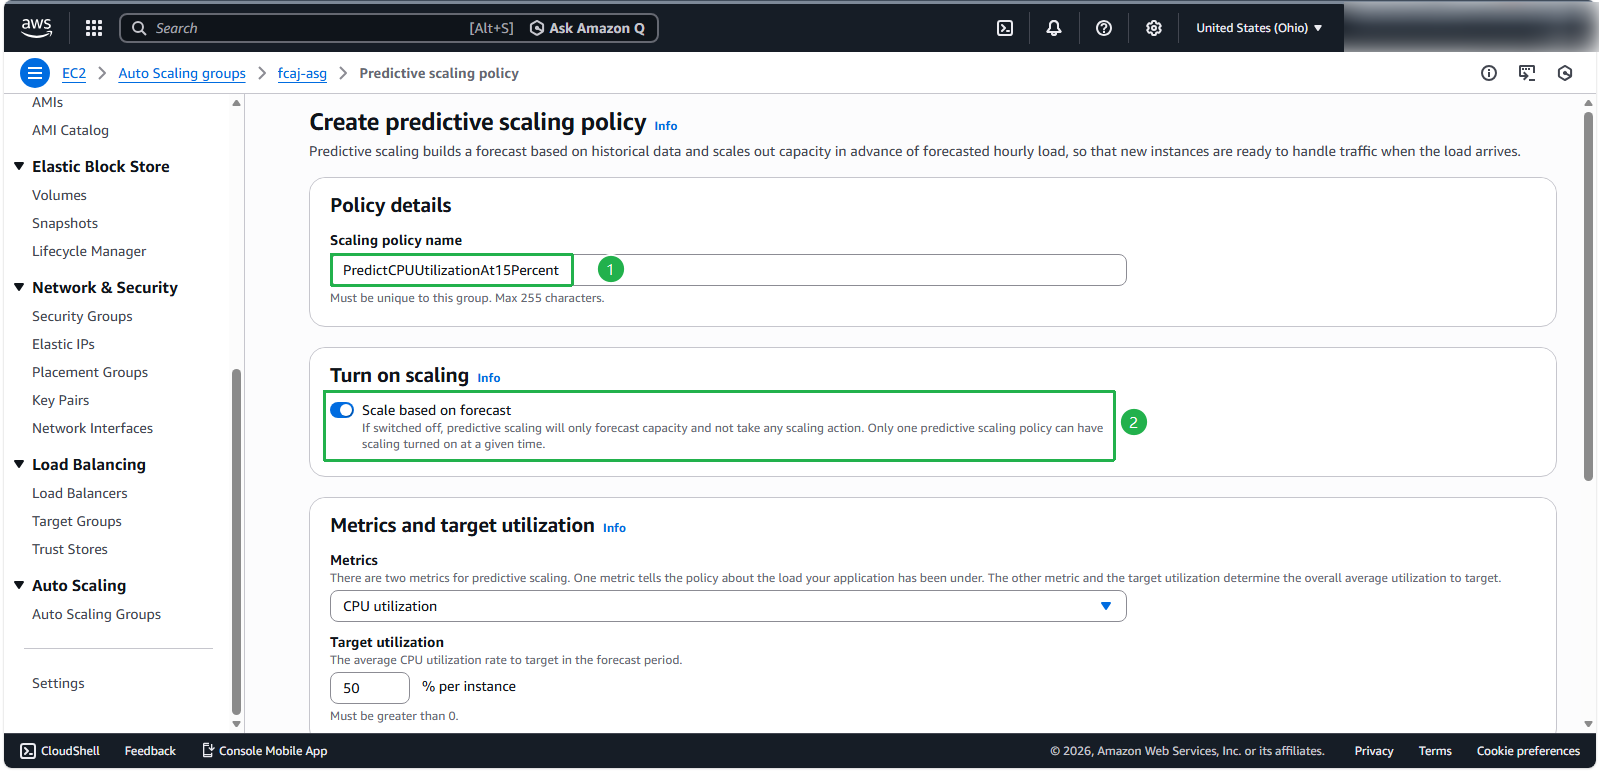
- In this form, we will configure as follows:
- Policy details
- Name:
PredictCPUUtilizationAt15Percent(you can choose any name) - Turn on scaling: enable Scale based on forecast. With the predictive scaling policy, essentially, it only makes predictions, but we can also use it to launch instances.
- Name:
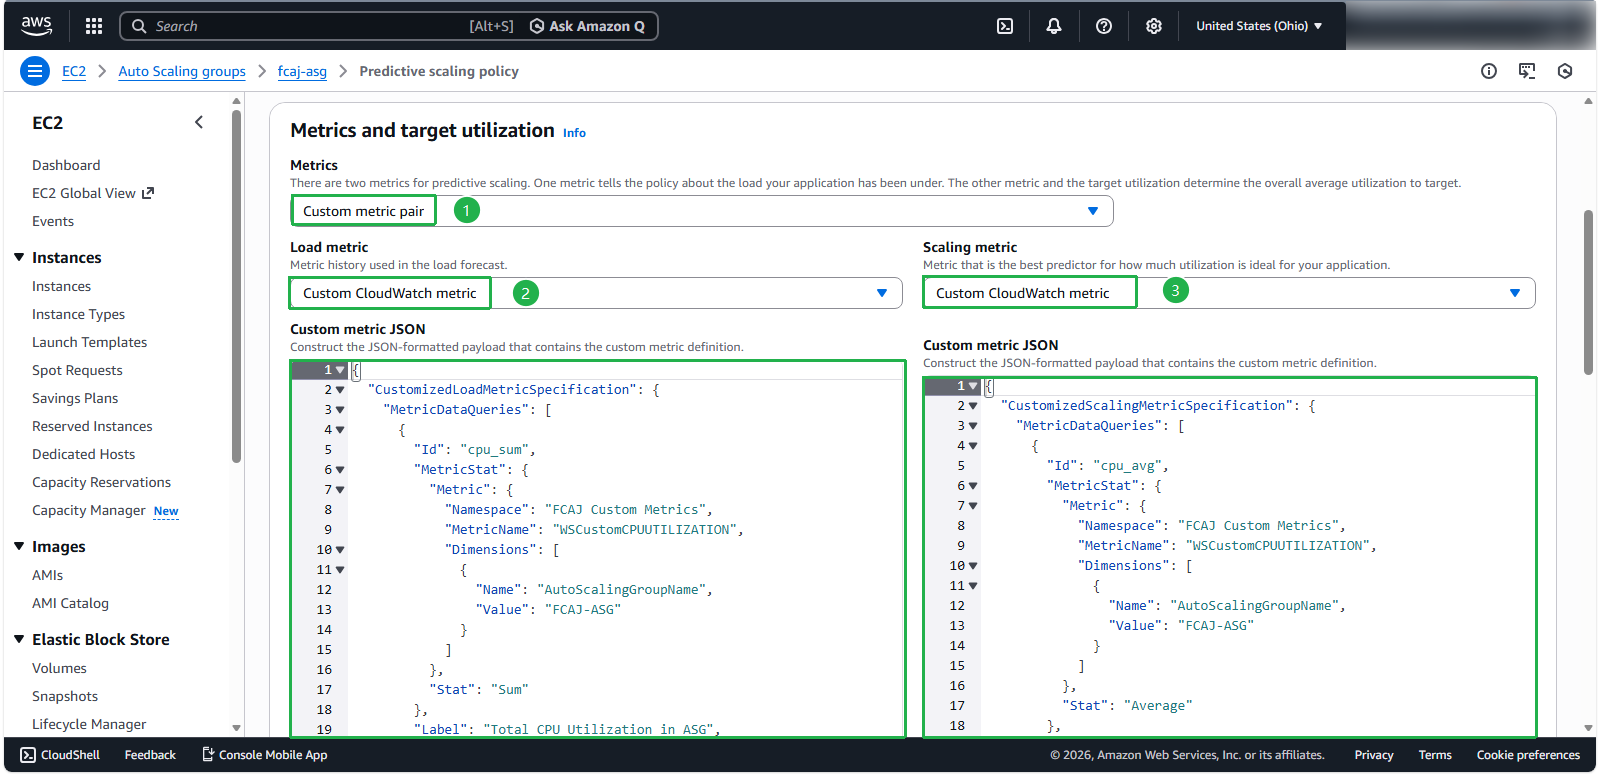
- Next, in the Metric and target utilization section:
- Metrics: select Custom metric pair.
- Load metric: select Custom CloudWatch metric.
- Scaling metric: select Custom CloudWatch metric.
- You will add custom metric JSON as follows:
- For Load metric
{
  "CustomizedLoadMetricSpecification": {
    "MetricDataQueries": [
      {
        "Id": "cpu_sum",
        "MetricStat": {
          "Metric": {
            "Namespace": "FCAJ Custom Metrics",
            "MetricName": "WSCustomCPUUTILIZATION",
            "Dimensions": [
              {
                "Name": "AutoScalingGroupName",
                "Value": "FCAJ-ASG"
              }
            ]
          },
          "Stat": "Sum"
        },
        "Label": "Total CPU Utilization in ASG",
        "ReturnData": true
      }
    ]
  }
}
- For Scaling metric
{
  "CustomizedScalingMetricSpecification": {
    "MetricDataQueries": [
      {
        "Id": "cpu_avg",
        "MetricStat": {
          "Metric": {
            "Namespace": "FCAJ Custom Metrics",
            "MetricName": "WSCustomCPUUTILIZATION",
            "Dimensions": [
              {
                "Name": "AutoScalingGroupName",
                "Value": "FCAJ-ASG"
              }
            ]
          },
          "Stat": "Average"
        },
        "Label": "Average CPU Utilization in ASG",
        "ReturnData": true
      }
    ]
  }
}
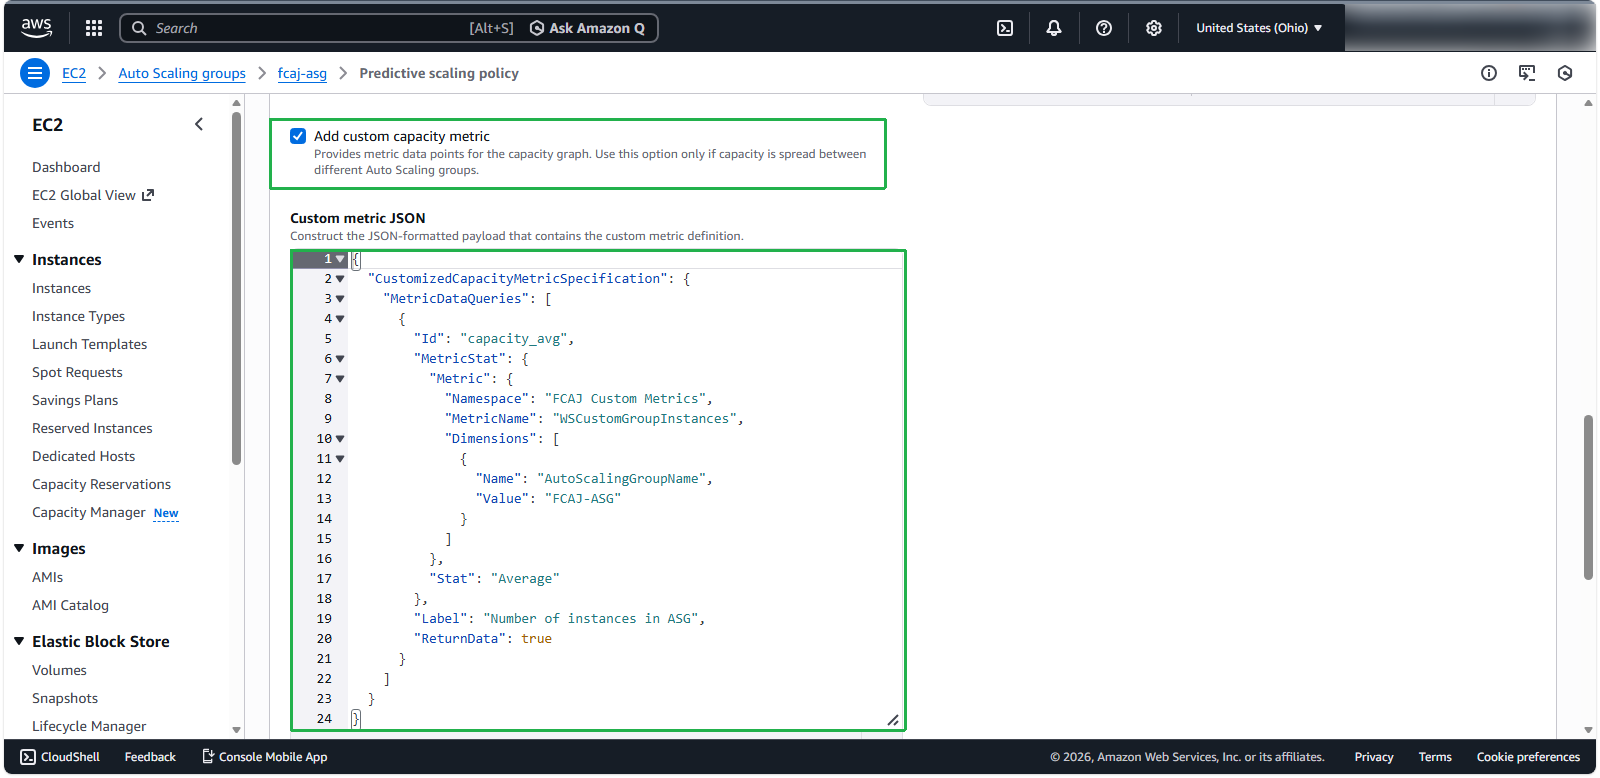
- Next, check Add custom capacity metric.
Similarly to the previous two steps, I will add custom metric JSON for Capacity metric.
{
  "CustomizedCapacityMetricSpecification": {
    "MetricDataQueries": [
      {
        "Id": "capacity_avg",
        "MetricStat": {
          "Metric": {
            "Namespace": "FCAJ Custom Metrics",
            "MetricName": "WSCustomGroupInstances",
            "Dimensions": [
              {
                "Name": "AutoScalingGroupName",
                "Value": "FCAJ-ASG"
              }
            ]
          },
          "Stat": "Average"
        },
        "Label": "Number of instances in ASG",
        "ReturnData": true
      }
    ]
  }
}
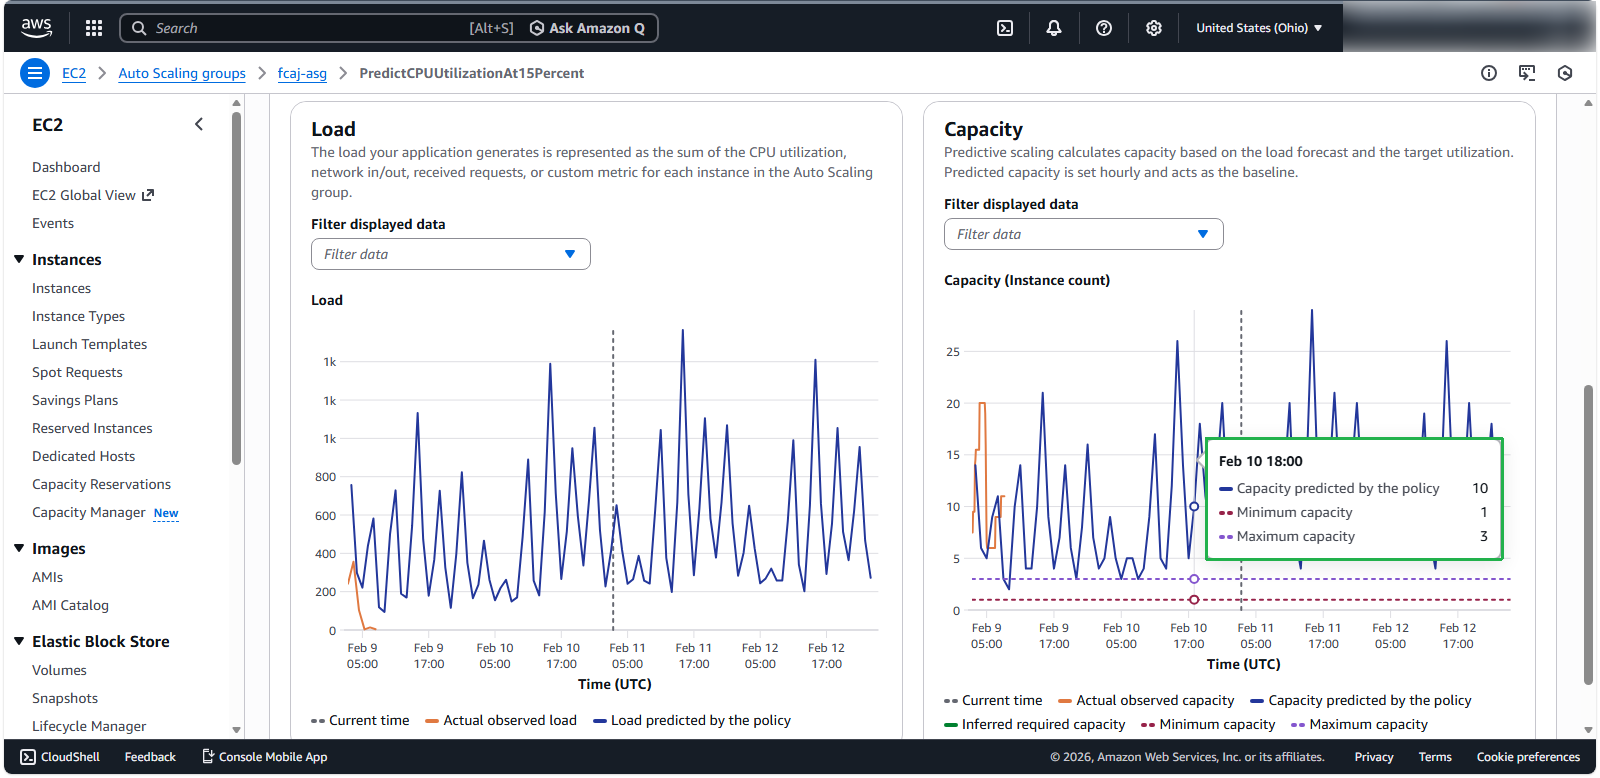
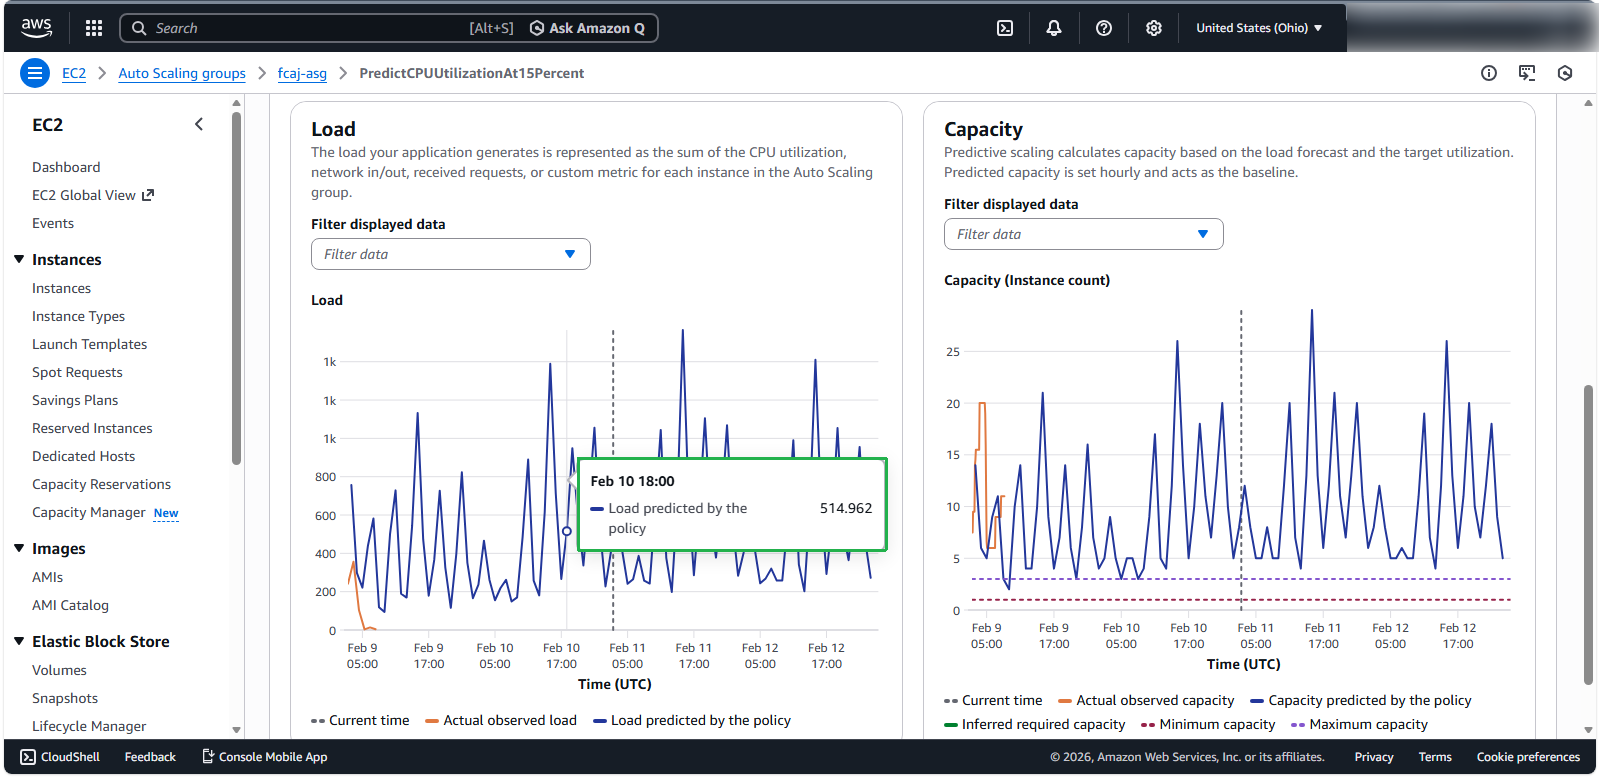
If you configured 2.6 - Prepare metrics for predictive scaling earlier, after completing the setup, you will see two charts displayed.
- In the Pre-launch instances section of Additional scaling settings - optional, set it to 1 minute. Click Create to create the policy.
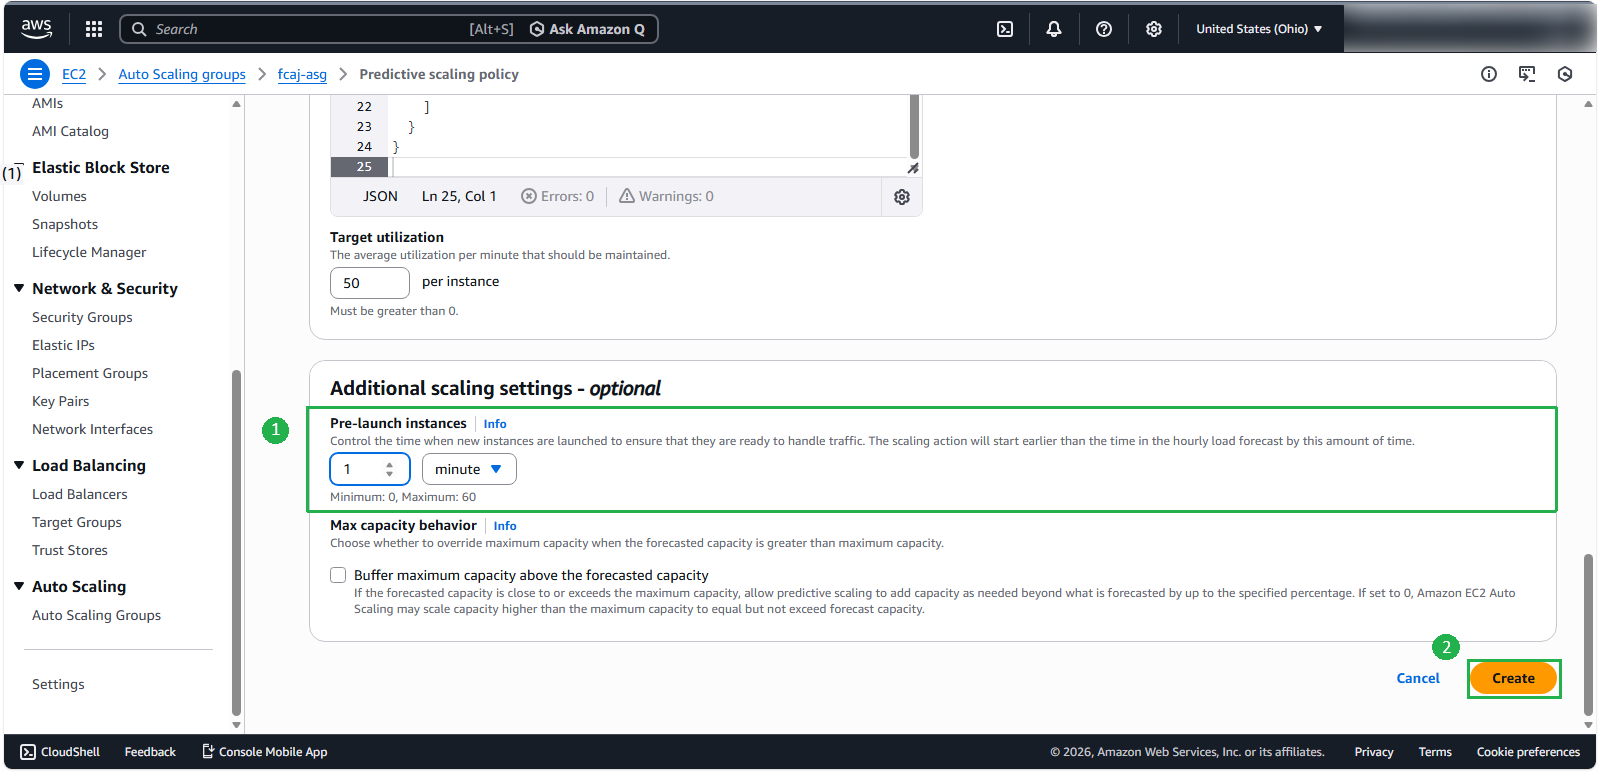
Similar to Dynamic scaling, this Pre-launch instances setting will affect when the instances will be launched. For example, if ASG predicts a peak at 23:00, it will launch instances at 22:59, according to the configuration.
- Check the results.
Reading Metrics from Sample Data
- In that policy, you will see two charts: Load and Capacity. These charts provide data on previous traffic and the number of instances used in previous days, allowing predictions for the upcoming days, represented by the purple line.
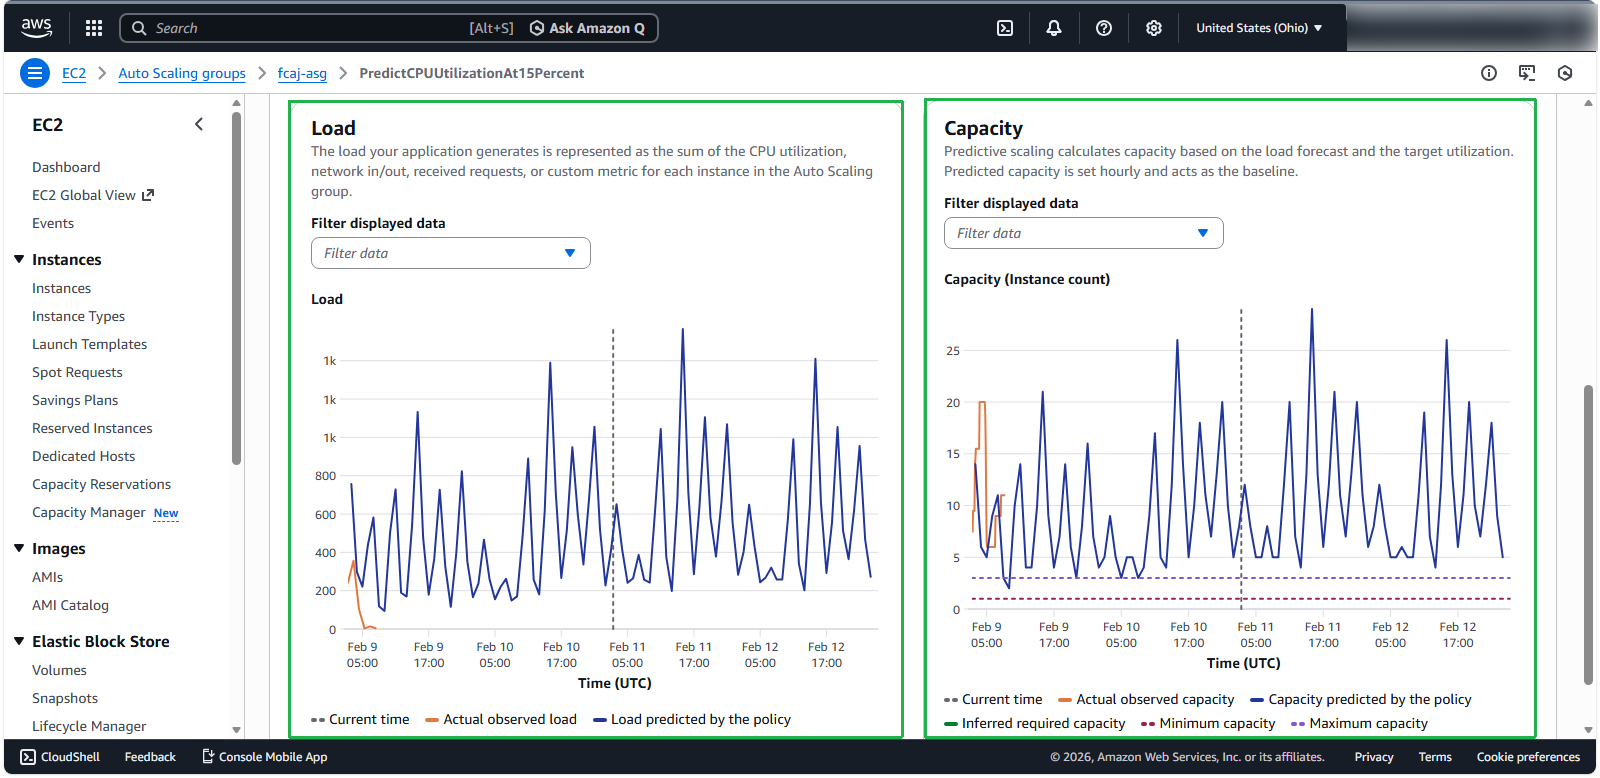
The chart is in UTC+0, and we are in UTC+7, so you’ll need to add 7 hours when reading these charts.
- First, focus on the chart on the left. At 15:00 UTC (which is 22:00 in Vietnam time), the total load was 1,565.465.
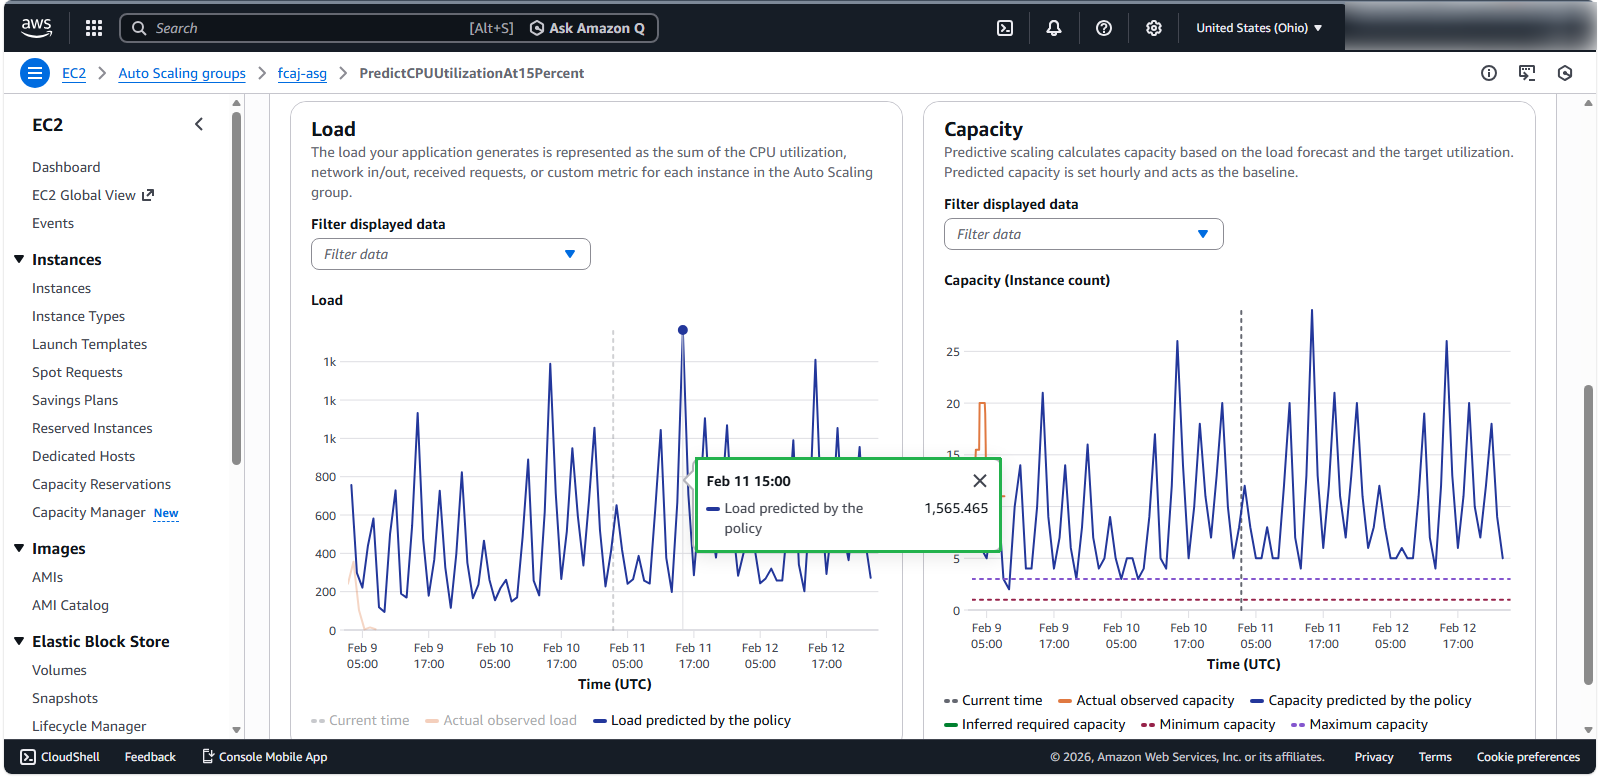
To understand what this number represents, look at the chart on the right.
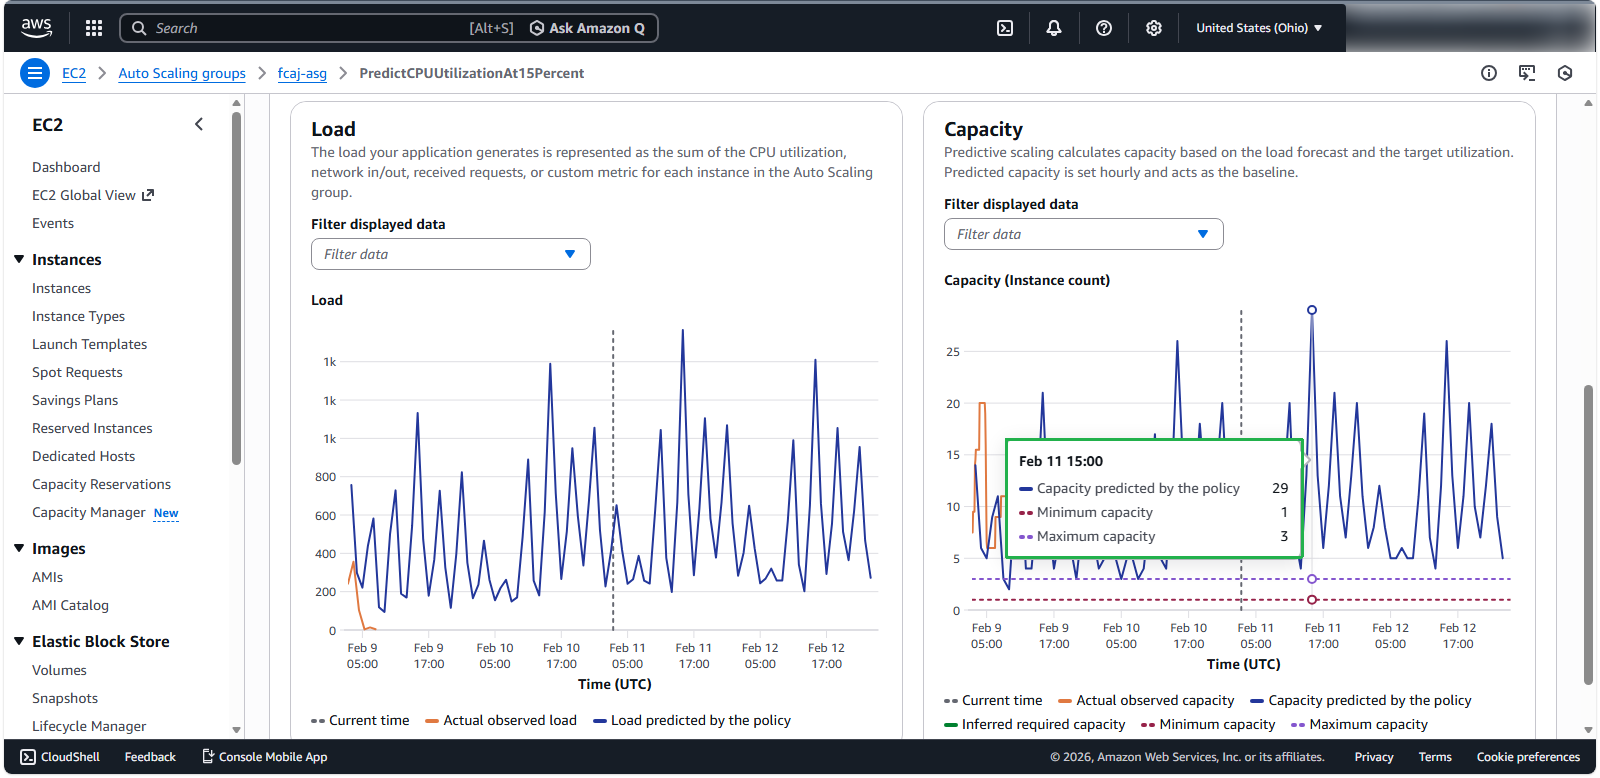
- We can see that at that time, 10 instances were predicted to be launched, and the load correlates with these instances. You can check other times as well.
Conclusion
We can combine Predictive Scaling with Dynamic Scaling or other scaling types to increase ASG’s flexibility and the system’s reliability. For systems with consistent load over time, using predictive scaling is also a reasonable approach.